|
|
Advanced Physics Projects for School & Home |
|---|---|
| opensource, real science on a budget |
|
|
Advanced Physics Projects for School & Home |
|---|---|
| opensource, real science on a budget |
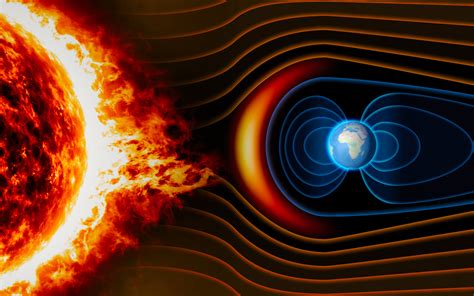
As the solar wind interacts with the upper atmosphere it distorts the earth weak magnetic field. Thus - rather perversely, monitoring variations in the earth's field via a magnetometer gives information on the strength of the solar wind and coronal mass ejections from the sun. During periods of high activity aurora may become visible.
Here is a low-cost nanoTesla resolution magnetic field sensor which monitors minute fluctuations in the earth's magnetic field caused by variations in the solar wind. A stable system, this has been left running for months at a time - uploading hourly data plots to a website. The code is well tested and robust with a modular design permitting easy adaptation and development by students of both the software and hardware. The system has been described in a paper in Physics Education Solar wind monitor—a school geophysics project. The code, construction details and an updated paper can be downloaded from github
| Live Earth Field Magnetometer, Guisborough, UK |
|---|

|

|

|
note: The system's current location is 'noisy' with step changes being caused by the movement of cars some 10+ metres away.
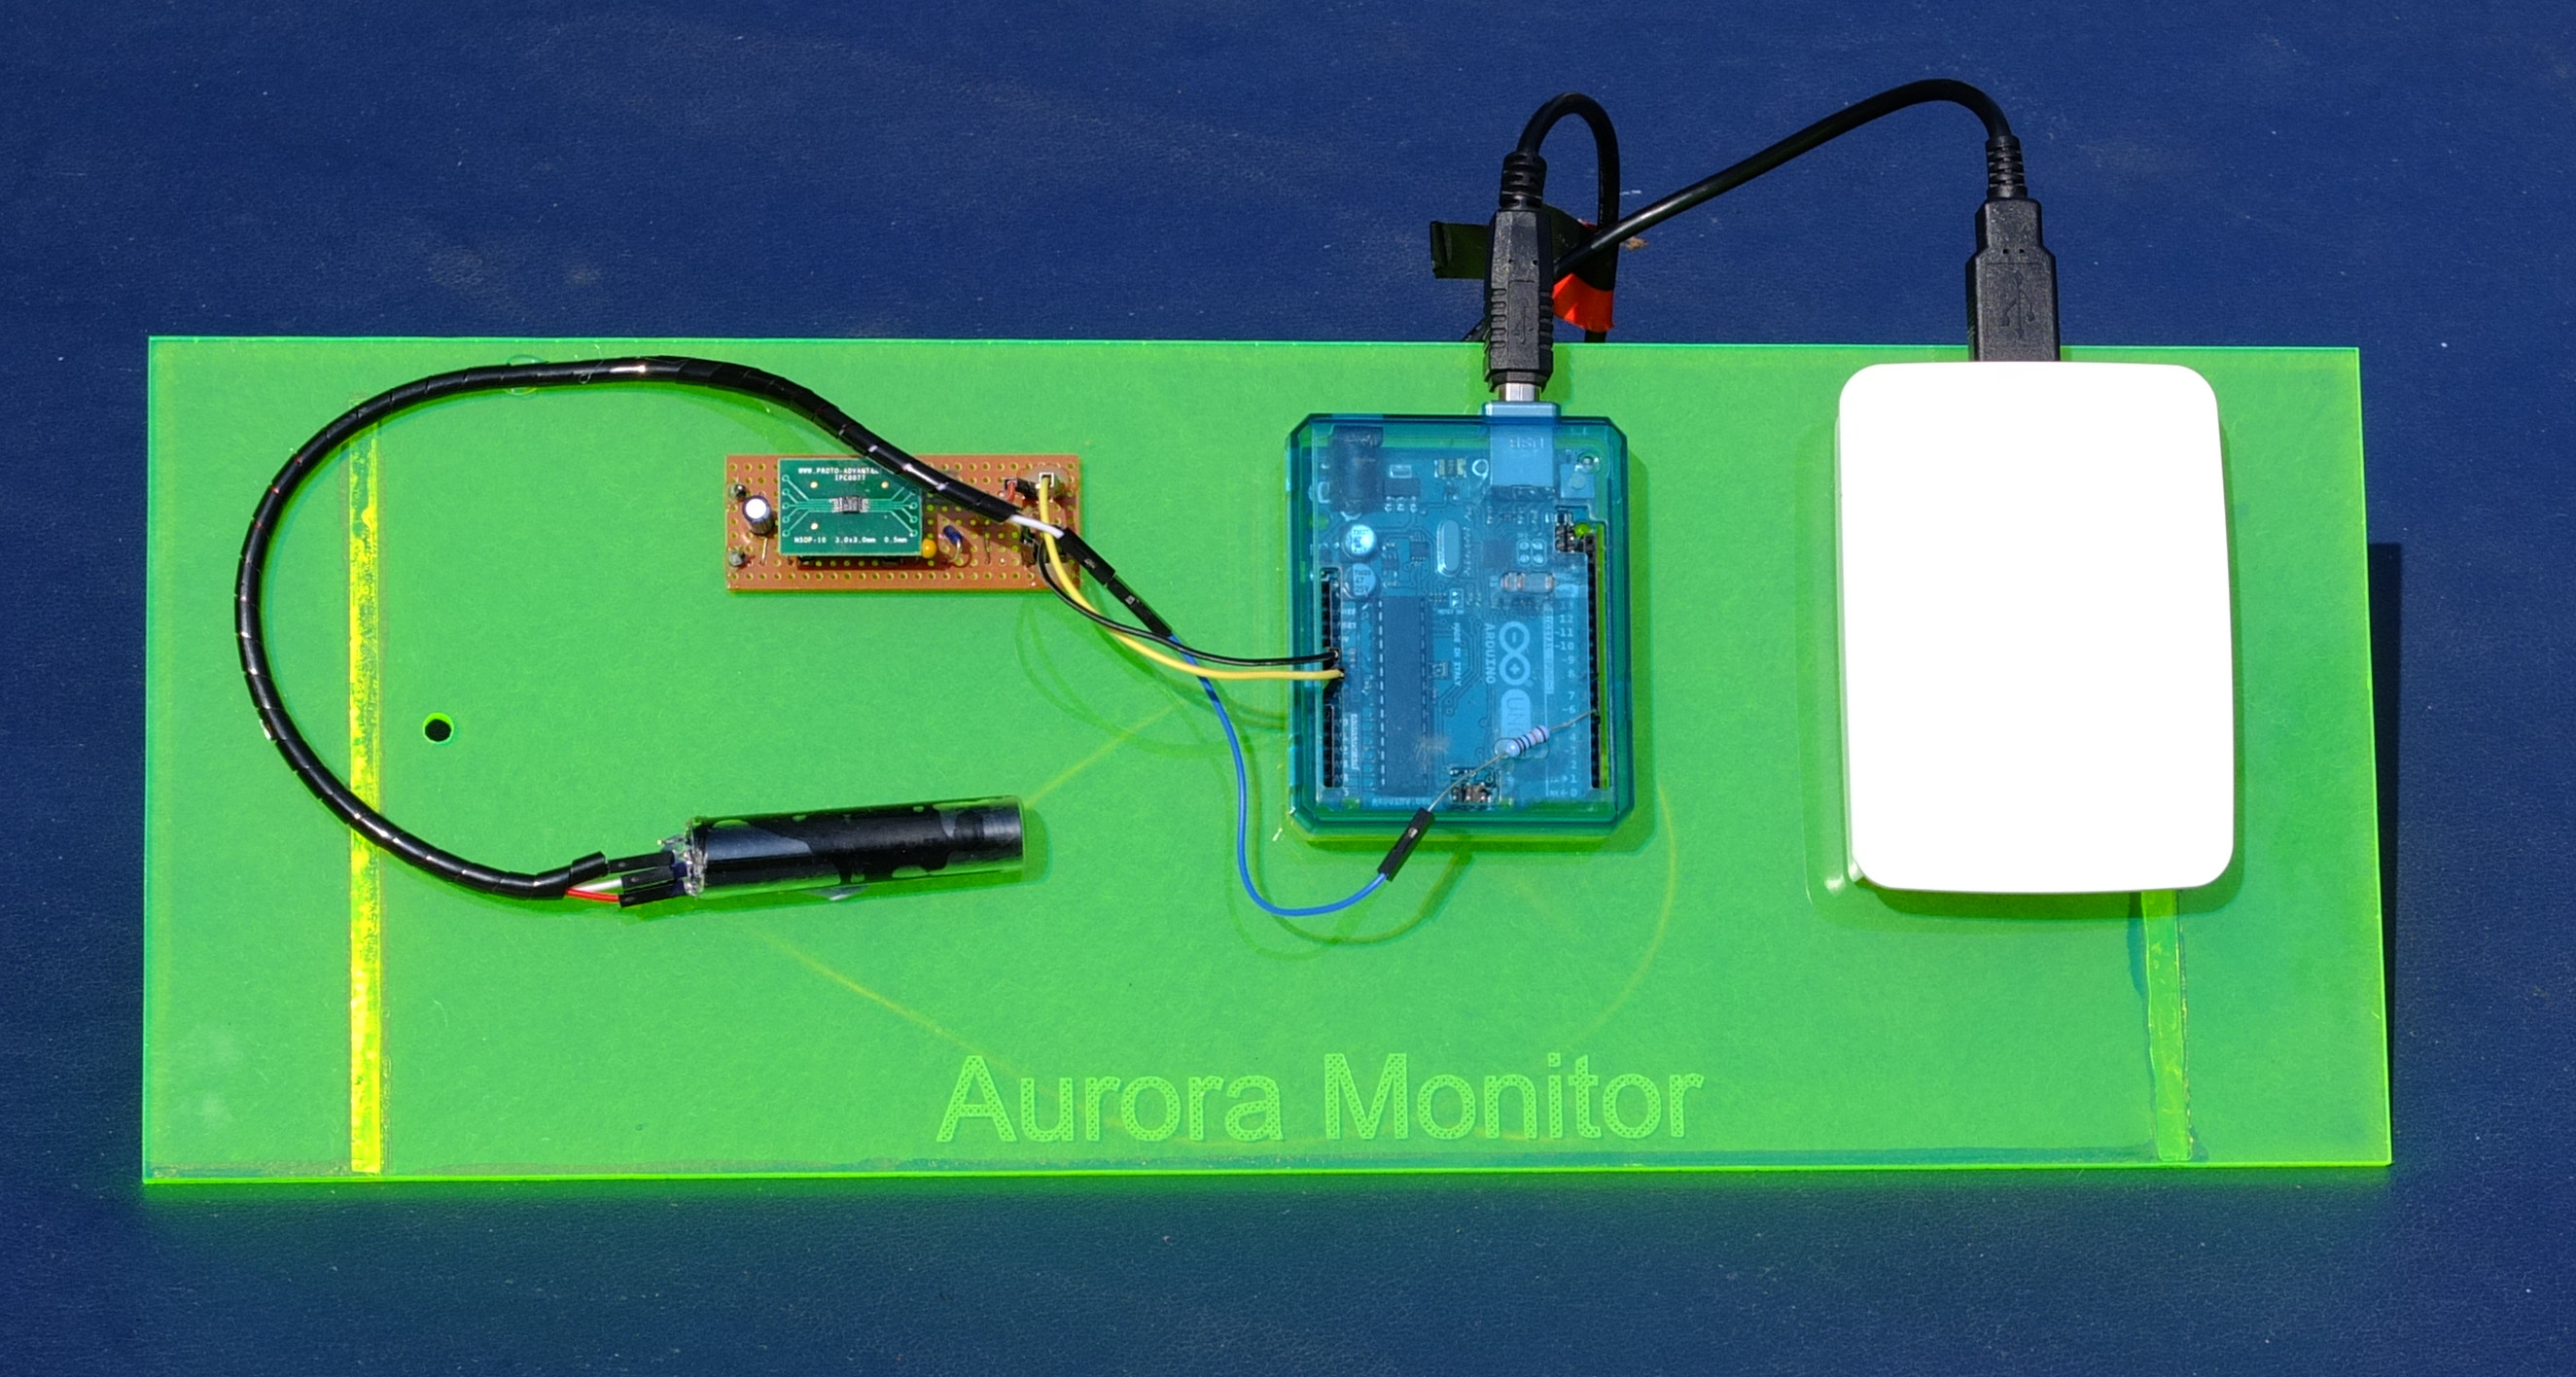
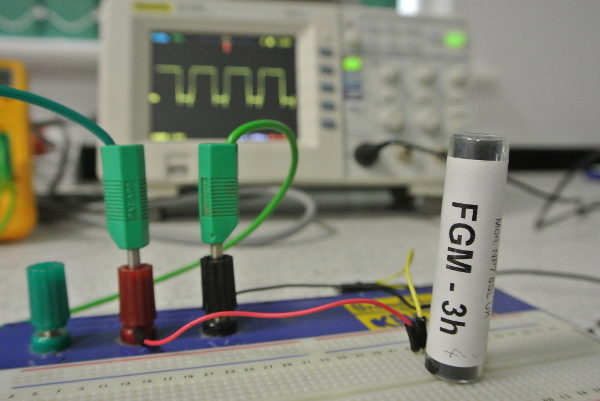
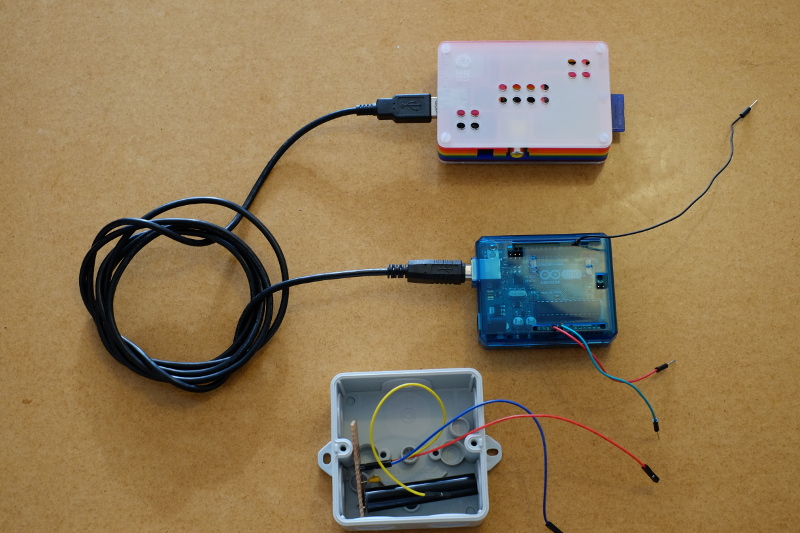
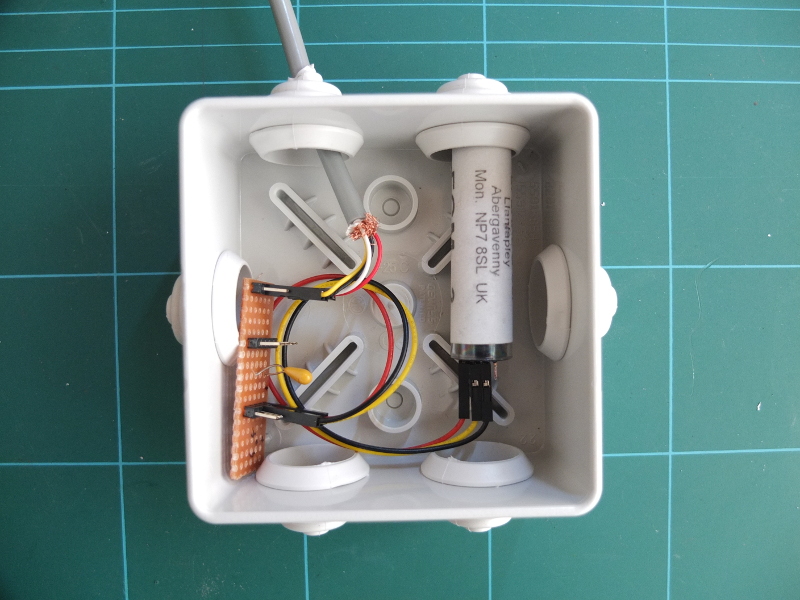
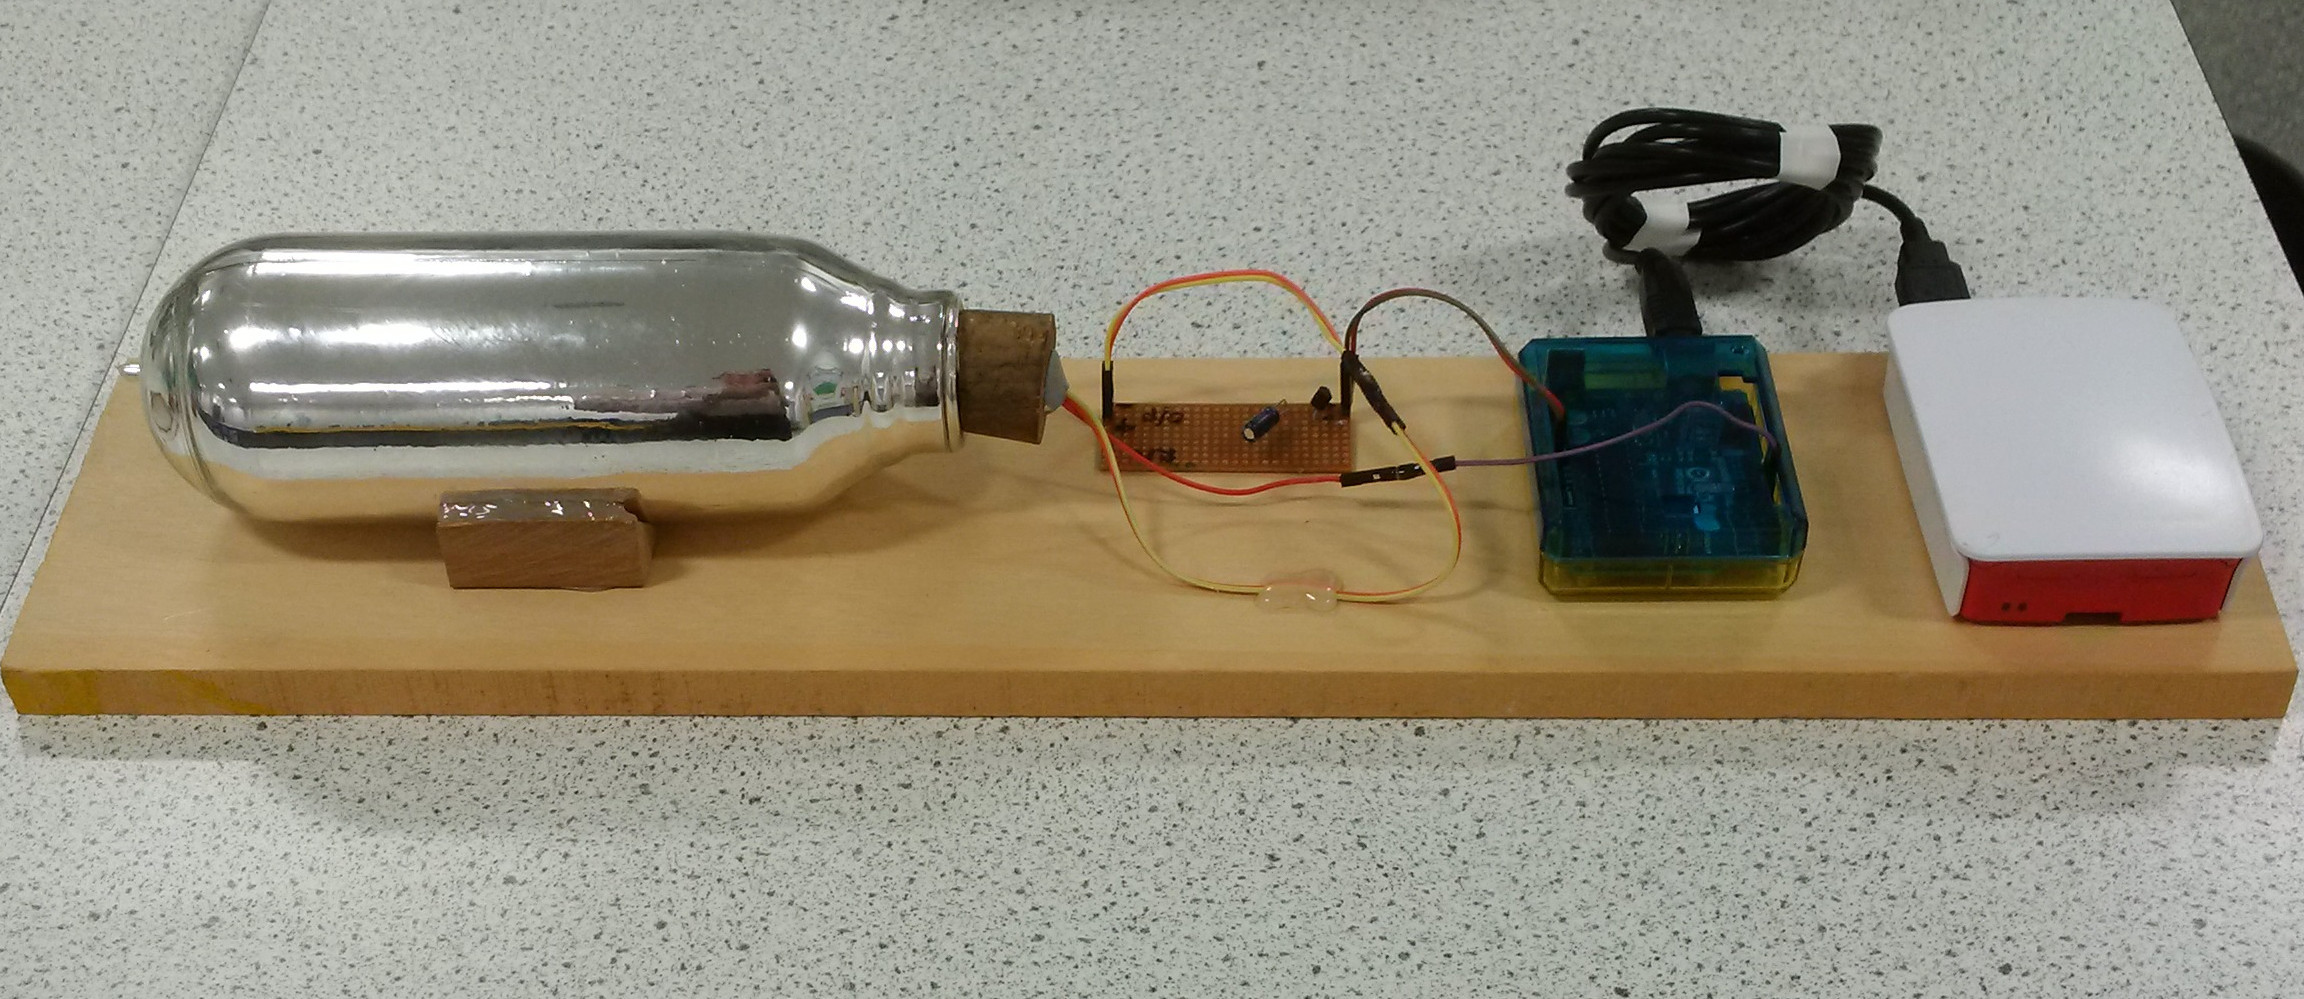
At its core is a FG3 fluxgate magnetometer (~£40) in a thermos flask. A simple signal cable connects to an Arduino Uno which monitors the ~50kHz square wave signal from the F.G.M as well as a temperature sensor. Data are transferred via USB to a headless networked Raspberry Pi which averages the frequency over 1 minute appending the timestamped results to a datafile. Data is plotted every hour using matPlotLib and these plots of the daily field variation, hourly standard deviations and monthly S.D.s are automatically uploaded to a website. The python script is robust enough to handle signal and power outages. As the FGM is sensitive to temperature the system may incorporate a temperature probe to allow further tweaking of the resolution. All data is stored in .mseed format, a geophysics standard permitting further analysis using tools such as ObsPy
The results look good. One may compare the plot above with that produced by the British Geological Survey using rather more expensive equipment - see B.G.S. Their nearest station is the middle set of plots - the yellow line being the E-W component measured here.
The project is simple to complete in its current form. The code is pre-written, easily modified and being Python can run on Windows, Linux, Mac or on a device such as a Raspberry Pi without modification. Being modular one can easily extend or adapt the code or hardware allowing for ongoing development at home or by a school science club.
Further development could include:-I have demonstrated this and other projects at the Maker Faires, Newcastle in 2016, 2017, 2018, the Science on Stage Festival - Prague, 2022 and at various teacher events. So far my geophysics projects have been personally funded and are published entirely open-source, pro-bono. Feel free to take, use, and improve.
The plots below show 4 consecutive days. Starting with solar quiescence with a typical sinusoidal shape due to sunlight ionising the upper atmosphere. This may be compared with subsequent plots as as coronal mass ejection interacted with the upper atmosphere following a magnitude x1.1 solar flare.
| E-W B Field, Guisborough, Uk | |
|---|---|

|

|

|

|

|
|