|
|
Advanced Physics Projects for School & Home |
|---|---|
| opensource, real science on a budget |
|
|
Advanced Physics Projects for School & Home |
|---|---|
| opensource, real science on a budget |
Aurora Monitor ... Infrasound Monitor ... Microbarometer ... seismicDelta
| Infrasound Monitor Presentation | Paper #1 | Construction Instructions |
| Tonga Event | ||
We have been working on a new geophysics project for the past 5 years, a compact infrasound monitor based on a digital, i 2c enabled differential pressure sensor. I feel this is a beauty. Very open-ended with lots of opportunities for students of all levels - primary to postgrad - to redesign and test replacement components. This is also real science, in a little studied area. Well suited to networking in small or large areas. Oh - and cheap! see Blog (above) for current status. A paper has been published in IOP Phys Ed and a number of users out there have built systems.
The system may be used either as a fixed monitoring station or taken out for on-site measurements. We have successfully measured infrasound at windfarms, on beaches and in cars. Interestingly we detected a clear signal from the Tonga eruption at a range of over 16,000km. This and the Aurora monitor were awarded by the Czech Society of Physics at the European 'Science on Stage' Festival in 2022.
This rig capable of resolving to better than 1 3-millionth of an atmosphere will cost less than £100 and provide plenty of valuable experience in computing, physics, electronics, and signal processing to a small team for a year or so.
Infrasound is a little studied area of geophysics/environmental science ripe for further investigation. The only U.K. detector I can find reference to is possibly one run by A.W.E. at Blacknest. Unsurprisingly precious little information is extant. A national network of school & college infrasound detectors could potentially generate useful scientific data as well as remarkable educational benefits. This will be our main push 26-27.
The code, construction details and an updated paper can be downloaded from github. A set of infrasound analysis routines and instructions are also available.
| Live Infrasound Readings, Guisborough, UK | |
|---|---|
| Rig Alpha: Loftspace - pitched tile roof wind-filter - 70Hz sample rate | |

|

|

|

|
The above are simple daily data plots. These are generated on the fly by the Pi used to monitor the sensor, and should be used for quick observation of output. The idea being that the data be downloaded from the PI for more detailed analysis. I have written a general analysis tool in python for this - examples below and on the Blog pages.

v3 2022 |
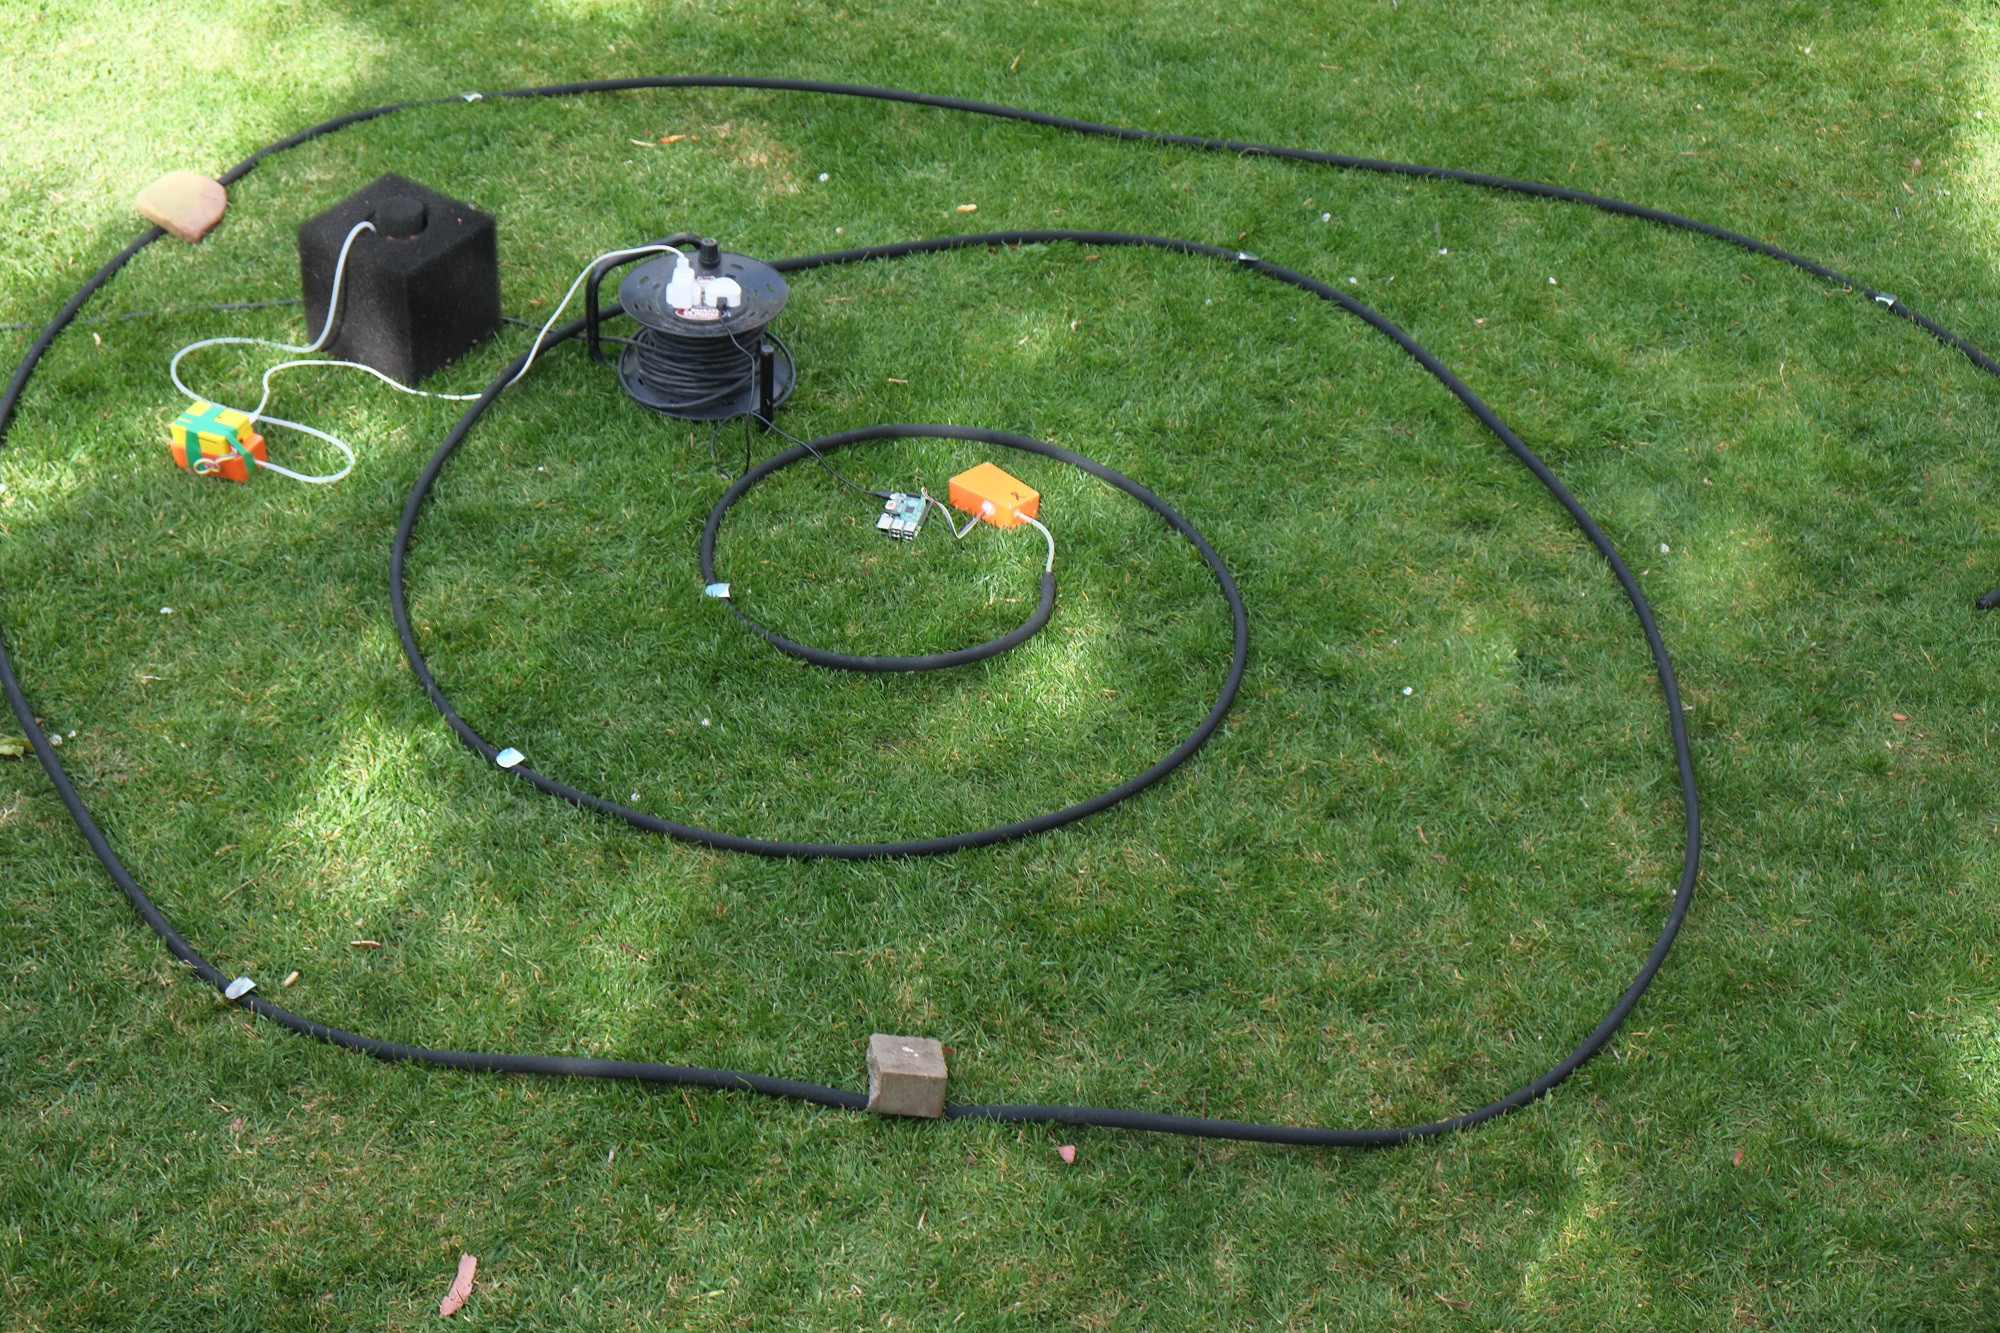
Testing foam block vs spiral porous hose windfilter |
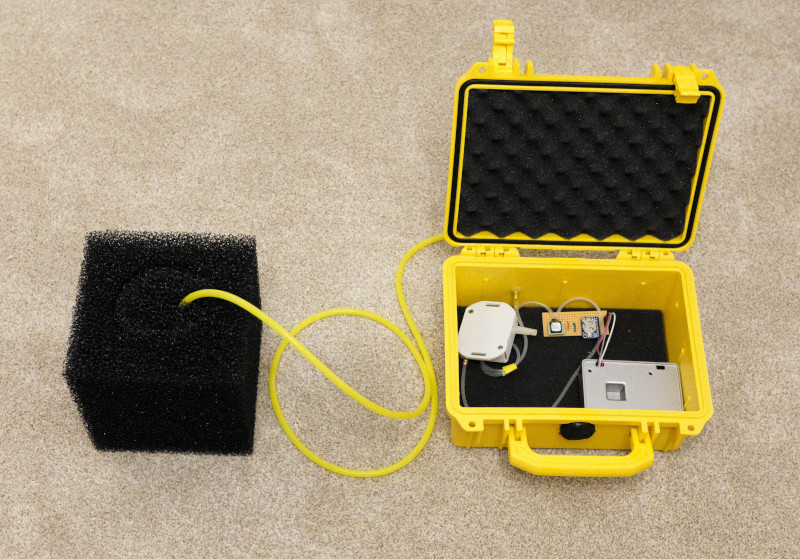
v4 Rig for Greenland - 2022 |
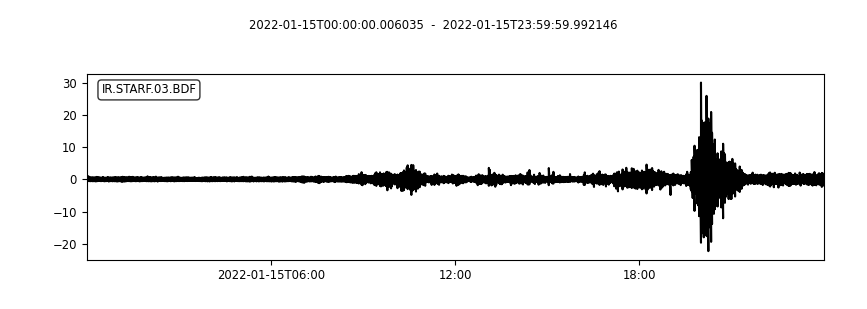
Tonga Eruption infrasound pulse |
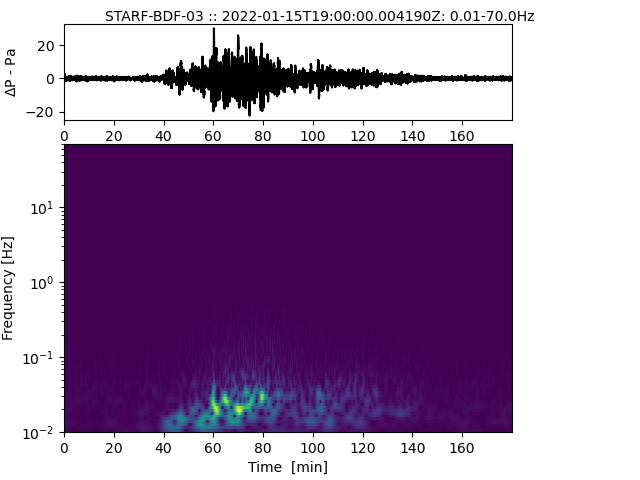
Tonga Eruption, infrasound spectrum |
|
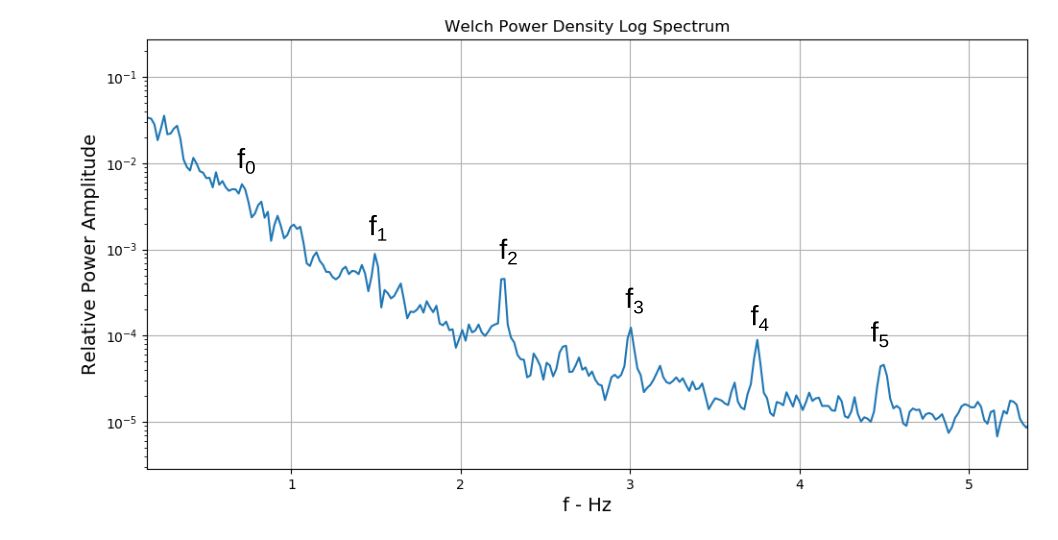
Frequency Spectrum near wind turbine |
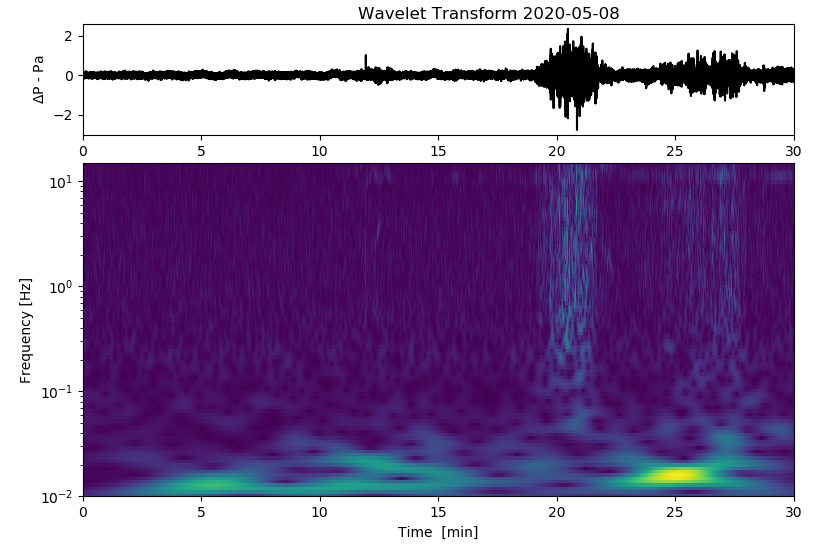
Helicopter at ~ 1km, foam block windfilter, 18 -> 28 min |
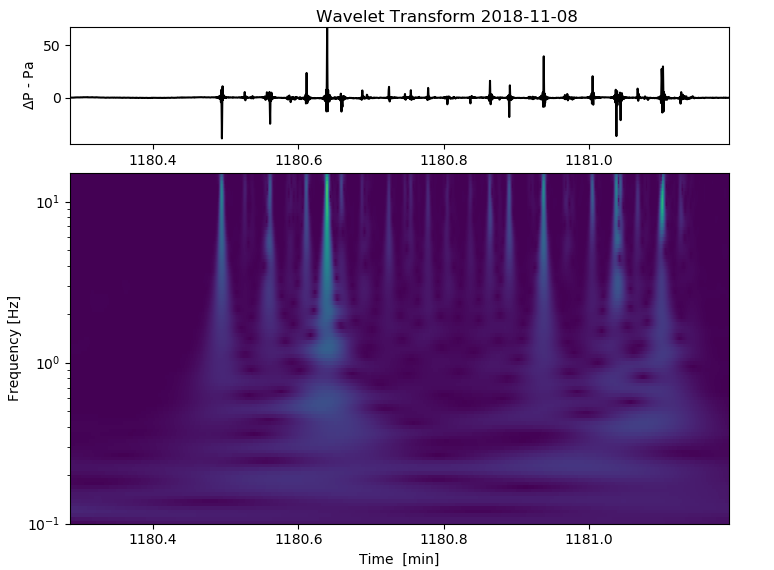
Fireworks |
We've been exploring techniques to 'visualise' infrasound signals. Sifting frequencies up to the audible range is an interesting alternative to graphical presentation. From Nathan's detection of the Tonga eruption (strictly Hunga Tonga–Hunga Ha'apai). This video is the primary pulse from Tonga sped up 500x. Thanks to https://sonify.readthedocs.io/en/latest/index.html for the base code.
---------------------------
As examples of real data see Blog posts for:-